iPhone & Android App use on the rise, 2011 vs 2012 app stats: How do you compare?
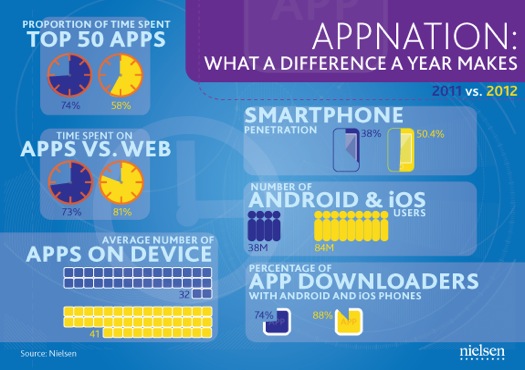
Since Nielsen’s 2011 AppNation report, a lot has changed. US smartphone users has now increased by 12.4%, making smartphone penetration to 50 percent in the US. This means that for every two mobile phone subscribers in the US, one will most likely have a smartphone in their pocket.
Android and iOS users dominate over all other mobile operating systems for app downloads. Between the two, iOS and Android devices account for 88 percent of apps downloaded in the past 30 days. This is up by 14% when compared to last years 74 percent.
The number of Android and iOS users has more than doubled in just one year. More than 84 million US mobile subscribers are proud owners of an iOS or Android device in 2012. Thats a big jump when you compare those 84 million to the 38 million in 2011.
With the rise of customers purchasing smartphones and tablet devices, more people now have access to all kinds of downloadable apps. According to Nielsen’s annual report, the amount of people that are downloading and spending more time using apps instead of using mobile web has gone up by 10% from 2011.
Lets break down the 2012 AppNation summary report:
- The average smartphone user currently has about 41 apps downloaded in their smartphone. That is up 28% from last years 32 app average. (Quick! Count your apps!)
- The average smartphone user that uses apps vs. getting on a computer and using the web is up by 81%, compared to 73% in 2011.
- The average smartphone user spends about the same amount of time using apps when compared to last year. In 2011 the average user spent 37 minutes a day compared to 39 minutes in 2012.
- The average smartphone user who is concerned over personal data collection has gone up by 3%, it was 70 percent in 2011 and now 73 percent in 2012. 55 percent say they are worried about sharing personal information.
Top 5 downloaded apps in 2012:
Here are the top Five Apps that are downloaded on smartphones for 2012.
- YouTube
- Android Market
- Google Search
- Gmail
Apps on mobile devices is still in its infancy in terms of what they are capable of doing and how we will use them in the future. Companies like Apple and Google have only scratched the surface on what we will be seeing in the future. Don’t expect to see this app trend to slow down anytime soon. Next year, these numbers will most likely be even higher.
The App stores and app developers are probably the happiest to see the way these type of reports are heading. Smartphone users are also winning, we get to choose from more apps and also better quality apps because of the competition.
So did you count how many apps you currently have downloaded on your smartphone? I thought 41 apps was a lot when I first read the report, come to find out I have 89 apps. Guess I’m above the average user on app downloads…
Let us know how many apps you have downloaded on your smart phone. Also, what are your top 3 apps you use on your mobile device?
Source: Nielsen
Share this article with friends!
Follow Us On...
blog comments powered by Disqus